
.jpg)
Search Console URL Inspection tool: 7 practical SEO use cases
The URL Inspection tool in Google Search Console isn’t just a checkbox for SEO professionals. It’s a direct line into how Google actually sees your page.
It shows you:
- If a page is indexed.
- How it was crawled.
- What resources were blocked.
- What structured data Google picked up.
- How the page renders for Googlebot.
You can even run a live test to compare the current version with what’s in the index.
But most SEOs barely scratch the surface.
This guide covers seven practical ways to use the URL Inspection tool to:
- Troubleshoot indexing issues.
- Uncover rendering problems.
- Confirm critical fixes.
- Make smarter technical decisions.
You’ll also learn what this tool can’t do – and how to avoid the most common mistakes when using it.
What is the URL Inspection tool, and why should SEOs use it?
To start using the tool, just paste the full URL into the URL Inspection bar at the top of Google Search Console.

The URL Inspection tool in Google Search Console lets you see how Googlebot crawls, renders, and indexes a specific page.
It provides both the indexed version (from the last crawl) and a live test that checks how the page looks right now. Here’s what it shows:
- Index status: Whether the URL is indexed, and if not, why (e.g., noindex, crawl errors, redirects).
- Crawl information: Last crawl date, crawl success or failure, and which Googlebot (mobile or desktop) was used.
- Indexing allowed: Whether the page allows indexing based on meta tags or HTTP headers.
- User-declared vs. Google-selected canonical: Comparison of the canonical URL you set and the one Google actually chose.
- Discovery info: How Google found the URL – via sitemap or referring page(s), if known.
- Live test results: Real-time test of the current URL to check crawlability, render status, and indexability.
- Rendered HTML: The final HTML after Googlebot executes JavaScript.
- Page screenshot: A visual of how Googlebot sees the page after rendering.
- JavaScript console messages (live test only): Any JS errors or warnings during rendering that might affect content or layout.
- Page resources: A list of all requested files (CSS, JS, fonts, etc.), showing whether each loaded, failed, or was blocked.
- Structured data (enhancements): Detected schema types eligible for rich results, with validation status (valid, warning, error).
- HTTP response headers: Full server response, including status code, X-Robots-Tag, Cache-Control, Content-Type, and more.
These data points help you understand:
- Why a page is or isn’t indexed.
- What Google sees on the page.
- What technical signals may be helping or hurting performance.

Advanced SEOs use it to:
- Troubleshoot indexing issues
- Confirm fixes.
- Understand exactly what Google sees on a page.
It’s one of the few tools that gives direct insight into Google’s processing, not just what’s on the page, but what Google does with it.
Below are some of the practical uses of the tool.
1. Check if a URL is indexed by Google
The most common use of the URL Inspection tool is to check whether a page is indexed and eligible to appear in Google Search.
You’ll get one of two verdicts right away:
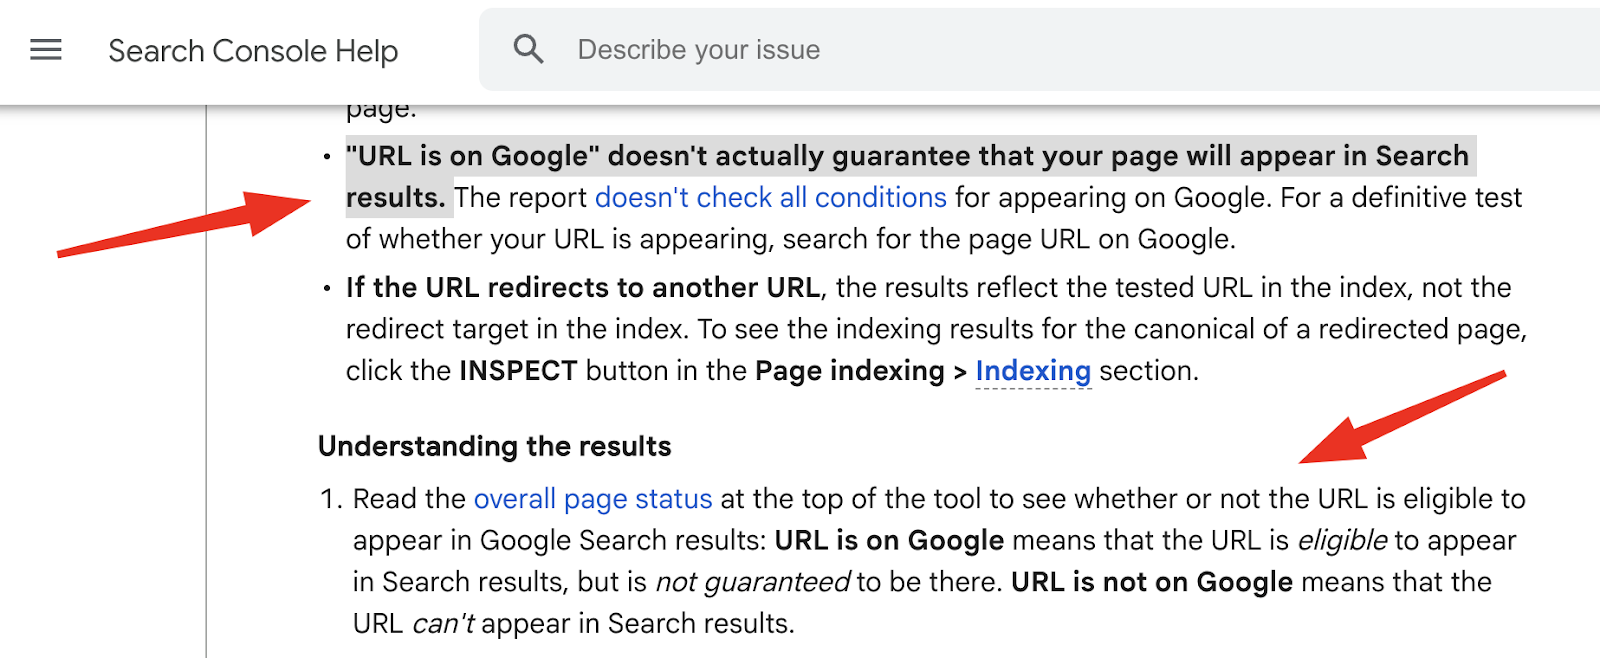
- “URL is on Google”: Indexed and eligible for search
- “URL is not on Google”: Not indexed, and won’t appear in results
It’s really important to know that “URL is on Google” means it can show up, not that it will show up in search results.
To actually show up in search, the content still needs to be high quality, relevant, and competitive.
Understanding how Googlebot finds, accesses, and crawls your website’s URLs is fundamental technical SEO.
The URL Inspection tool gives a lot of detailed info on this, mostly in the Page indexing section of the inspection report for a URL:
- Discovery: This section tells you how Google found the URL. It can list Sitemaps that include the URL and Referring page(s) that link to it. If Google found the URL in ways it doesn’t specifically report, it might say, “URL might be known from other sources that are currently not reported.”
- Last crawl: This shows the exact date and time of Google’s most recent crawl of the URL, usually in your local time. If the URL hasn’t been crawled yet, this field will show N/A.
- Crawled as: This tells you which user-agent Googlebot used for the crawl.
- Crawl allowed?: This shows Yes if crawling is allowed, or No if it’s blocked (e.g., “No: blocked by robots.txt”). It might also show N/A if a crawl attempt hasn’t been made or the status isn’t clear.
- Page fetch: This describes what happened when Google tried to get the page content. Statuses can include:
- Successful.
- Failed: Soft 404.
- Failed: Not found (404).
- Failed: Crawl anomaly (meaning other unspecified fetching problems).
- Failed: Redirect error (if Google had trouble following redirects).
- Indexing allowed?: This tells you if indexing is allowed for the URL, usually based on meta robot tags (e.g., noindex) or HTTP headers.
- Canonical: Your declared canonical vs. the one Google selected

If a key page shows “URL is not on Google,” you should dig into these fields to find out why.
It could be a simple noindex tag, a robots.txt block, a redirect, or something bigger, like content Google sees as low quality.

Seeing multiple important pages not indexed?
That could signal broader issues:
- Crawl blocks.
- Misconfigured tags.
- Even site-wide quality problems.
Even though the tool checks one URL at a time, a smart SEO will look for these patterns that might mean a bigger, site-wide investigation is needed.
The URL Inspection tool is useful, but not perfect.
Keep these limitations in mind when reviewing indexing:
- It shows the last indexed version, not the live one. If you’ve made recent changes, they won’t appear unless you run a live test.
- “URL is on Google” ≠ visible in search. Again, this only means the page is eligible, not guaranteed, to appear. For confirmation, search for the exact URL in Google.

- If the URL redirects, the report shows the status of the original URL – not the final destination. You’ll need to inspect the target URL separately.
- “URL is on Google, but has issues” means the page is indexed, but enhancements like structured data are having problems. Expand the sections to see what’s flagged.
- You must inspect the exact URL that belongs to the verified property in Search Console. Inspecting the wrong version (e.g., https:// vs http://, or www vs non-www) will return invalid or missing data.
2. Ask Google to index new and updated pages
The Request Indexing button in the URL Inspection tool lets you ask Google to recrawl a specific URL.
It’s useful for getting new pages or recently updated content into the index faster, especially after fixing critical issues or launching something important.

When you submit a URL, Google adds it to its crawl queue.
But this doesn’t guarantee that the page will be indexed or show up in search results quickly.
Indexing can still take days or even weeks, and only happens if the page meets Google’s quality and technical standards.
Things to keep in mind:
- No shortcuts: Repeated submissions won’t speed up crawling.
- Indexing isn’t guaranteed: If the page is low quality, blocked, or broken, Google will skip it.
- Quota limits apply: You get around 10–12 manual submissions per day per property in the GSC interface. Exceed it, and you’ll see a “Quota exceeded” message.
- For bulk indexing, use the URL Inspection API (2,000 requests/day, 600/minute).

This feature works best when used strategically – for priority content or after important fixes. Just requesting indexing won’t fix broken pages.
You should make sure the page:
- Is technically clean.
- Has internal links.
- Is in your XML sitemap.
- Offers valuable content.
Submitting a URL is just a request. Google still chooses whether it’s worth indexing.
3. See what Google sees
The URL Inspection tool doesn’t just tell you if a page is indexed – it shows how Googlebot renders and understands the page.
This is especially useful for JavaScript-heavy sites, where critical content or structured data may only appear after rendering.
You can access this view by clicking View crawled page for the indexed version or View tested page after a live test.

Both provide a breakdown of how Googlebot sees the page, including:
- Rendered HTML: The final DOM after JavaScript runs. Essential for checking if content injected by JS frameworks (React, Vue, etc.) is actually visible to Google.
- Screenshot: A visual preview of what Googlebot “sees” after rendering. Useful for spotting broken layouts or missing content.
- Page resources: A list of every CSS, JS, image, or font file the page tries to load, with status indicators (loaded, blocked, or failed).
- JavaScript console messages: Only visible in live tests. These expose script errors or warnings that might prevent content from loading.
- Page type: Confirms the content type (e.g., text/html, application/pdf), which affects how Google processes the page.
If Googlebot can’t load a key script or a critical resource like CSS is blocked by robots.txt, it might render the page incorrectly or not index it at all.
Missing resources can break mobile layouts, suppress structured data, and hide important content.
The JavaScript console output (from live tests only) is a goldmine for catching errors that would otherwise go unnoticed, like:
- Broken third-party scripts.
- Missing modules.
- Rendering failures that block Google from seeing your content.
You can also catch early signs of site issues, such as unauthorized third-party scripts or injected code.
If the rendered HTML or resource list looks unfamiliar or off-brand, it might be a clue that something deeper, like a plugin conflict or even malicious code, is affecting your site.
If your page depends on JavaScript to display key elements, run a live test.
Only then will you see JS console messages and verify that your content is actually being rendered and indexed.
For modern websites, this is one of the most important checks in your SEO toolkit.
Get the newsletter search marketers rely on.
Post a Comment
0Comments